[See update at 5a and 5b: light on who's unsubsidized]
HHS released its midterm report on ACA private plan enrollment for 2016 today. A few observations:
1. While HHS was obviously lowballing when it published enrollment projections in October, enrollment has already hit the lower range of those projections. The targets were 11.0--14.1 million plan selections by Jan. 31, 2016, including 2.8--3.9 million new customers. As of Dec. 26, all exchanges combined had just shy of 11.3 million enrollees, including 3.0 million new customers.
2. The enrollee pool in the 38 states using HealthCare.gov is slightly wealthier this year than last. For 2016 to date, 37% of hc.gov enrollees for whom income data is available have incomes in the 100-150% FPL range. As of the end of OEII last February, 40% were in that range.There have been proportionately more buyers with incomes over 250% FPL this season. The difference is probably due to new Medicaid expansions in Pennsylvania, Indiana and Alaska, which probably put a couple of hundred thousand private plan enrollees into Medicaid.
3. Silver and bronze plan selection rates have remained stable overall with silver plan selection actually upticking a bit on HealthCare.gov, from 69% last year to 71% so far for 2016. For all states combined, bronze selection is stable at 22% (21% on the federal exchange). While that's still too high in my view, I had feared that the bronze share might climb steadily as premiums rise. Of course, the 82% of enrollees who are subsidized are largely shielded from those price hikes -- benchmark silver costs subsidized buyers only a few dollars more this year than last. Since the pool is slightly wealthier this year, no increase in bronze selection is probably a gain, as wealthier buyers tend more toward bronze.
4. The average premium subsidy is up 11.8% this year, from $263 to $294. That's right in line with overall estimates of premium prices increases in 2016.
5. As I've noted previously, a slight uptick in younger enrollees may be due in part to the premium increases, which cause more young buyers to be subsidy-eligible. That doesn't mean they pay any less, but some that bought off-exchange in the past, or would have done so this year, may be driven to the exchange by subsidy eligibility.
5a UPDATE: Charles Gaba has shed some light on something from this data that I've been wondering for a while: a lot of buyers over 300% FPL (and lower at younger ages) don't qualify for subsidies:
5 8% of enrollees did not report income and so are not subsidized. Adding 3% over 400% FPL, that means that 10 7% of hc.gov enrollees were unsubsidized and reported incomes under 400% FPL. Most but not all are probably over 300% FPL. A number of young unsubsidized buyers may have incomes as low as 250% FPL
The unsubsidized include not only those who earn too much to qualify for subsidies, but also people disqualified for subsidies because an offer of insurance from an employer is deemed affordable. That includes those stuck in the "family glitch," for whom coverage is deemed affordable for the employee alone, even if family coverage would cost way more than the 8% of income threshold. It also includes those who don't enter income information for whatever reason. I suspect, too, that in a number of cases it includes legally present immigrants who are time-barred from Medicaid but whose incomes are under 100% FPL in nonexpansion states or 138% FPL in expansion states. These people are supposed to be subsidy-eligible, but I suspect that in many cases, if their income is in Medicaid range, the system is not responsive enough to coordinate their immigration status and open the gate for premium subsidies. I know this was the case in 2014; it may be improved now. Outside hc.gov (where the stats above apply), in 2015 enrollment data in Maryland shows anomalously high bronze plan selection in the 100-138% FPL range, suggesting many deemed unsubsidized in that band, and California shows 37% of buyers under 138% FPL unsubsidized (see "state level tables" in June 2015 profile, here).
5b. An afterthought: the percentage of hc.gov enrollees for whom income is unknown (8%) is up from the end of OEII in 2015, when it was about 6%. Perhaps that's another sign that the pool is somewhat wealthier this year, as most people who don't report income earn too much to qualify for subsidies. Could the individual mandate be pulling more subsidy-ineligible buyers into the pool?
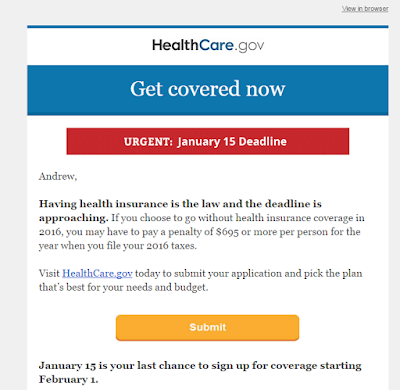
6. HealthCare.gov is no longer coy about wielding the tax penalty stick. This email went out today:
HHS released its midterm report on ACA private plan enrollment for 2016 today. A few observations:
1. While HHS was obviously lowballing when it published enrollment projections in October, enrollment has already hit the lower range of those projections. The targets were 11.0--14.1 million plan selections by Jan. 31, 2016, including 2.8--3.9 million new customers. As of Dec. 26, all exchanges combined had just shy of 11.3 million enrollees, including 3.0 million new customers.
2. The enrollee pool in the 38 states using HealthCare.gov is slightly wealthier this year than last. For 2016 to date, 37% of hc.gov enrollees for whom income data is available have incomes in the 100-150% FPL range. As of the end of OEII last February, 40% were in that range.There have been proportionately more buyers with incomes over 250% FPL this season. The difference is probably due to new Medicaid expansions in Pennsylvania, Indiana and Alaska, which probably put a couple of hundred thousand private plan enrollees into Medicaid.
3. Silver and bronze plan selection rates have remained stable overall with silver plan selection actually upticking a bit on HealthCare.gov, from 69% last year to 71% so far for 2016. For all states combined, bronze selection is stable at 22% (21% on the federal exchange). While that's still too high in my view, I had feared that the bronze share might climb steadily as premiums rise. Of course, the 82% of enrollees who are subsidized are largely shielded from those price hikes -- benchmark silver costs subsidized buyers only a few dollars more this year than last. Since the pool is slightly wealthier this year, no increase in bronze selection is probably a gain, as wealthier buyers tend more toward bronze.
4. The average premium subsidy is up 11.8% this year, from $263 to $294. That's right in line with overall estimates of premium prices increases in 2016.
5. As I've noted previously, a slight uptick in younger enrollees may be due in part to the premium increases, which cause more young buyers to be subsidy-eligible. That doesn't mean they pay any less, but some that bought off-exchange in the past, or would have done so this year, may be driven to the exchange by subsidy eligibility.
5a UPDATE: Charles Gaba has shed some light on something from this data that I've been wondering for a while: a lot of buyers over 300% FPL (and lower at younger ages) don't qualify for subsidies:
About
- Income Level: (this is for HC.gov states only):
- 3% are below 100% FPL (eh???)
- 37% are at 100-150%
- 24% are at 150-200%
- 15% are at 200-250%
- 9% are at 250-300%
- 9% are at 300-400%
This is kind of interesting, as it's a reminder that being under 400% FPL does not guarantee that you'll receive tax credits (remember, 18% aren't receiving financial assistance, but only 3% are over 400% FPL, so there's an additional 15% who are under 400% but don't qualify for credits for whatever reason)
- 3% are over 400% FPL
The unsubsidized include not only those who earn too much to qualify for subsidies, but also people disqualified for subsidies because an offer of insurance from an employer is deemed affordable. That includes those stuck in the "family glitch," for whom coverage is deemed affordable for the employee alone, even if family coverage would cost way more than the 8% of income threshold. It also includes those who don't enter income information for whatever reason. I suspect, too, that in a number of cases it includes legally present immigrants who are time-barred from Medicaid but whose incomes are under 100% FPL in nonexpansion states or 138% FPL in expansion states. These people are supposed to be subsidy-eligible, but I suspect that in many cases, if their income is in Medicaid range, the system is not responsive enough to coordinate their immigration status and open the gate for premium subsidies. I know this was the case in 2014; it may be improved now. Outside hc.gov (where the stats above apply), in 2015 enrollment data in Maryland shows anomalously high bronze plan selection in the 100-138% FPL range, suggesting many deemed unsubsidized in that band, and California shows 37% of buyers under 138% FPL unsubsidized (see "state level tables" in June 2015 profile, here).
5b. An afterthought: the percentage of hc.gov enrollees for whom income is unknown (8%) is up from the end of OEII in 2015, when it was about 6%. Perhaps that's another sign that the pool is somewhat wealthier this year, as most people who don't report income earn too much to qualify for subsidies. Could the individual mandate be pulling more subsidy-ineligible buyers into the pool?
6. HealthCare.gov is no longer coy about wielding the tax penalty stick. This email went out today:

No comments:
Post a Comment